Log Analysis in Azure Data Lake, Chapter 3

Time for some real profiling, and right away I discover a reason to do this.  On my first run my script failed with this error:

Error occurred while extracting row after processing 12360 record(s) in the vertex' input split. Column index: 10, column name: 'user_agent'.

...

Invalid character is detected following the ending quote character in a quoted field. A column delimiter, row delimiter or EOF is expected.
This error can occur if double-quotes within the field are not correctly escaped as two double-quotes.

I hunted down the offending entry and found this data in the user_agent column (truncated for safety and space):

"}__test|O:21:\"JDatabaseDriverMysqli\":3:{s:2:\"fc\";O:17:\"JSimplepieFactory\":0:{}s:21:\"\\0\\0\\0disconnectHandlers\";a:1:{i:0;a:2:{i:0;O:9:\"SimplePie\":5:{s:8:\"sanitize\";O:20:\"JDatabaseDriverMysql\":0:{}s:8:\"feed_url\";s:3814:\" (lots more I'm not showing here)

This error occurs several times across a number of files, so it’s not just a one-off fluke.  Through some searching I found this was a Joomla exploit, but WordPress doesn’t seem to be affected.  This is interesting, and confirms exploits are being attempted against sites frequently.

Because this log entry isn’t parsing correctly, and is throwing a fatal error, I need to figure out both how to keep processing past the errors, and also how to catch and log these errors.

According to U-SQL Error: Unexpected number of columns in input record, there is a “silent : true” option I can add to my EXTRACT statement, but this is meant for times when the column number differs, not other types of errors.  Catching other errors is a little more complicated, and according to the same article the best option right now is with a custom extractor, so it looks like I might need that after all.  Eliminating invalid entries is one strong reason to have a transformed zone.

User Defined Extractor

Microsoft has some basic documentation on programming user defined extractors.  There isn’t any discussion about best practices for structuring a project or unit testing, but there’s a basic example.  At the time of his blog post the documentation is pretty lacking, so the rest of this post represents a couple weeks of trial and error.  I will be contributing to the documentation, too.  The code sample for this project can be found at https://github.com/rjdudley/AzureDLLogParser.

User-defined extractors (UDEs) are one of several types of user-defined objects (UDOs) supported by the Azure Data Lake.  If you’re familiar with the common language runtime (CLR) in SQL Server, UDOs are analogous to CLR Objects.  If you’re not familiar with CLR Objects or Azure Data Lake UDOs, you just need to know they are both .NET classes which can be called by the query code.  The methods in the UDOs can be called like a standard function.  Needless to say, UDOs can be very powerful.  In fact, one of the “killer features” of Azure Data Lake is being able to easily extend the functionality of the query language using languages and tooling you’re very familiar with.

To begin creating a UDE, you start by adding a new “Class Library For U-SQL Solution” to your solution.  This is a template project with all the necessary references, you could use a regular class library and then add all the references yourself.  Be lazy, use the template.

image

Since a UDE is a .NET class (in this example, C#), I also recommend unit testing.  There is a “U-SQL Test Project” but that’s meant for testing the U-SQL code.  Just use a regular class library and include your favorite unit test framework (my sample uses NUnit).

In your UDE project, add a new class file.  This class needs to implement IExtractor, and needs to be decorated with the SqlUserDefinedExtractor attribute.  This attribute indicates this is the class with the entry point.  IExtractor has one required method, named Extract, which as two parameters–input and output.  They are exactly what they sound like–input is the data we’ll be acting on, and output is the object we’ll build up through our processing.

public class Class1 : IExtractor    
{
     public override IEnumerable<IRow> Extract(IUnstructuredReader input, IUpdatableRow output)
     {
         throw new NotImplementedException();
     }
}

Input is an unstructured object, which means processing is completely up to us.  Whether it’s deserializing JSON or XML, or splitting on some other delimiter, or anything else, that’s probably the first thing we do.  On my case, splitting on a space was not the best solution because of the data structure.  Instead, I’ll use a regular expression (yes, I know, now I’ll have two problems) to parse the entry, and then piece the data together in a more coherent manner.

Inside the Extract function is where we do the initial splitting of the input, call our helper methods, and return the output.  The SELECT I wrote in Chapter 2 retrieves an entire file at one time, and passes that into the input (refer to https://github.com/rjdudley/AzureDLLogParser/blob/master/LogAnalysis/Script.usql).  I then need to split the file on the newline character to get an array of the individual rows, then iterate through the rows, as seen in https://github.com/rjdudley/AzureDLLogParser/blob/master/LogParser/LogFileReader.cs:


public override IEnumerable<IRow> Extract(IUnstructuredReader input, IUpdatableRow output)
{
string line;
//Read the input line by line
foreach (Stream current in input.Split(_row_delim))
{
using (StreamReader streamReader = new StreamReader(current, this._encoding))
{
line = streamReader.ReadToEnd().Trim();
LogRowParser splitter = new LogRowParser();
LogRowElements parts = new LogRowElements();
parts = splitter.ParseElements(line);
// …
yield return output.AsReadOnly();
}
}
}

view raw

gistfile1.txt

hosted with ❤ by GitHub

I added two additional classes: LogRowParser and LogRowElements.  I did this to make unit testing easier.  Most of the actual work I need to do will be done in LogRowParser.

To reiterate, it’s inside the Extract method where we process the input–whether we deserialize XML or JSON, or split a file on a line terminator, or whatever.  The result will be a collection of objects, or lines of a file, or whatever, which we then process using additional classes.  We build a row of data using output.Set<T>(), which is then passed back into the U-SQL EXTRACT statement.

Returning data back to the EXTRACT statement looks weird but makes sense when you think about it.  The “output” object is of type IUpdateableRow, so we have to set the type and value of each column using Set<T>(index, value) method.  For this to work correctly, you need to follow the same order as specified in the EXTRACT statement.

Once all the inputs have been processed, we then have a dataset we can perform one or more SELECT statements against.  In our model, the results of these SELECT statements would then be persisted in our transformed zone.  That’s the next chapter, though.

Once the UDE code is written and our tests pass, it’s time to really test it out.  If you’re so inclined you can create a local debugging instance (see https://docs.microsoft.com/en-us/azure/data-lake-analytics/data-lake-tools-for-vscode-local-run-and-debug) but that seems like a lot of effort for limited functionality.  Personally I found it easier to deploy to the cloud instance and run there, and you need to get the assemblies there anyway so it’s not wasted knowledge.

Just as you need to register SQL CLR objects in your SQL Server database, you also need to register UDOs in your U-SQL catalog.  Documentation is at https://blogs.msdn.microsoft.com/azuredatalake/2016/08/26/how-to-register-u-sql-assemblies-in-your-u-sql-catalog/.

To save you some time: in Visual Studio, you register assembly by right-slicking on the C# project, choosing “Register Assembly”, change any values you need to (I kept all defaults for the purposes of this blog series), and clicking Submit.

image

Once your assembly is registered, you can submit your U-SQL script.  If all goes well, your results will end up in your transformed zone.  This took me weeks of my “after the kids are in bed” time to get this all working.

End Notes

This blog post went through many, many edits as I worked this all out over several weeks, and it’s still terribly stream of consciousness for which I apologize.  It took some time to put all the pieces together, so if your stuff doesn’t work at first just keep working on it.  As I mentioned above I’ll contribute to the official documentation as well as continuing this blog series.

Turns out using a regex to parse web server logs is a fairly common practice.  Most of the examples focus on a pattern for the whole string, such as http://statmodeling.com/regular-expression-for-apache-log-parsing.html and https://www.regextester.com/95830 for a couple examples.  My host’s log format is a little different than the Apache combined log format, so I needed to tweak that regex a bit.  I used https://regex101.com/ to build my regex, which is saved at https://regex101.com/r/IKP5nb/1.  I did try to use this pattern, but it proved to be difficult.  I may try again later in this series to improve the code, but to just get the thing working I decided to split on quoted text pattern, using  https://stackoverflow.com/questions/17465099/regex-how-to-split-string-with-space-and-double-quote.  This means I’ll have to do some manipulations to the data during extraction but that’s an opportunity to learn.

Data Warehouse vs Data Lake

In discussions of data lakes, questions about the differences between and the future of data warehouses inevitably arise.  In the modern corporate information factory there is a place for both, and with the availability of managed cloud offerings it’s possible to do both even on a small scale.

Let’s start by reviewing data warehouses.  A data warehouse is a highly curated, highly structured database.  A data warehouse may use fact tables or dimensional cubes, and the ETL process is designed to put only the highest quality data into rigid structures.

Data warehouses excel and answering the same questions over and over with high fidelity and high performance.  This is an important business capability since many enterprises rely on periodic sales reports or inventory levels or manufacturing details.  Additionally, data warehouses are designed to return these answers quickly, and reports can often be run on demand with up-to-the-minute data.

Because they are structured for a purpose, and both ETL and queries are schema bound, changing a data warehouse is not a trivial task.  This doesn’t lend itself to just keeping data around to explore “what-if” scenarios or exploratory data analysis.  Data warehouses aren’t good structures to keep data around “just in case”, so there are occasions where you’ll find yourself thinking “if only we had the rest of the data!”

Data lakes are designed to be that way to keep the rest of the data in a cheap and explorable way.  Data lakes are designed to store large amounts of data in its raw form, and to provide different ways of exploring the data.  Although you could set up a data lake for reporting, that’s not the best use of the technologies.  Data lake technologies are less suited for repeated answers, and are more designed for exploratory analytics.  Data lakes are essentially unindexed heaps, so queries may take some time run when executed on demand.  A lot of answers (or inputs to analyses) from data lakes are precalculated using map/reduce jobs.

Let’s run thorough a thought experiment and see how a data warehouse and a data lake can work together.  Imagine we’re a manufacturing company with a data warehouse which we use to report on manufacturing output, error rates, scrap amounts, etc.  Raw data are written on paper forms, and supervisors enter the data into an application.  An ETL process takes the data from this application’s database and loads both the data warehouse and the data lake.

Some of the company leaders have been reading studies which show the affect of changing the brightness of lights in a factory on manufacturing output.  It has been decided that we’ll run week-long tests with brighter and dimmer lighting, and see which one gives us better results compared to a previous week.

After a week of elevated lighting and a week of decreased lighting, we run our usual reports out of the data warehouse and see that elevated lighting seemed to improve output and decrease shrink by a small percentage, while decreased lighting had a small negative effect.  It seems clear that we should brighten the lights to squeeze out a little more productivity.  But then someone has an observation–the week we turned the lights up was unseasonably sunny, while the week we turned the lights down was typical crappy January.

How easy would it be to test the effect of weather on our study using our data warehous?  Since weather could include temperature, sunlight and precipitation, all of which would need to be added to dimensional models it probably wouldn’t be easy.  And since we’re operating on a hunch, the work may not be worth it.  However, it would be very easy to download historical data for the weeks of our test, or even for the past several years, into our data lake and run some ad-hoc analyses looking at one or more weather feature.  If it turns out we want to add weather to our reports, we can update our data warehouse, ETLs and reports.  We could even download forecasts and do some predictive analytics.

The allure of big data technologies isn’t just the ability to work with huge datasets, but being able to run dozens or hundreds of analyses on medium-to-small datasets for analyses just like this.  When paired with traditional warehousing, data professionals have two very powerful tools.

Log Analysis in Azure Data Lake, Chapter 2

My task this time is profiling the log data.  I love profiling data, to me it’s like people watching at the mall.  You find a lot of interesting stuff just by looking.  The profiling task will actually accomplish four things:

  1. I’ll get to test recursive or wildcard querying in U-SQL.
  2. I’ll get to see if the subfolders named for the log year are good idea by how messy #1 is.
  3. I’ll have some profiled data I can use when I start my analysis queries.  I know from past experience that one of the columns in a log file is the byte size of the resource being requested, but not all resources have a byte size (like a default route URI).  In this case the server stores a “-” instead of a numeric value.  This would break my analytics unless I handled this situation.
  4. I’ll see if saving results to a flat file in an output folder is a good idea, or if I should switch to database tables.  Profiling is an intensive task, and sometimes it’s good to offload objects in memory, or run in parallel.  In either of these cases outputting to a flat file isn’t always the best idea.

Before I start any profiling, I need to get my log data out of my files and into a consolidated dataset.  That’s the focus of this blog post, the actual profiling will start in the next post.

Results: Getting one file to work

First thing I’m going to do is get data from just one hardcoded file.  If I know one file works, I always have a fallback if things are being wonky.  The Azure Data Lake Explorer in Visual Studio (not to be confused with the Azure Storage Explorer I mentioned previously, which is a standalone application) has several useful functions on its right-click menu.  When I drill down to a file, I can Preview the first 100 lines, which will give me an idea of how the U-SQL EXTRACT function will interpret the file with zero work on my part.  The second function is creating that EXTRACT script, which I can use as-is or tweak to suit my needs.

image

With just a click of a button, I get this, and I can see how the files will be processed.  Apache server logs are sort of space delimited, but not really.  This is why they’re so hard to process is the standard tools.  For instance, the timestamp is wrapped in square brackets, which a space between the time and offset.  This results in Column 3 having the date and time, plus a leading “[“, and Column 4 with the offset and a trailing “]”.  Also, the method, URL and protocol are all quoted in the log file, so they end up in the same column, Column 5.

image

Since this log is for a blog hosted on a shared server, I don’t have control over the file format, but the challenges are what makes this project fun.

To get useful data, I’m going to have to clean up and reassemble the timestamp, and also split apart Column 5 into its components.  This is exactly why I have a raw ad a transformed zone in my storage–I don’t want to have to do these (and other transforms) in the query every time I want to run some analysis; I’d prefer to run my analyses against the transformed data.

Something to consider at this point is that I could build a user-defined function which would process the rows a little more intelligently (see

Extending U-SQL Expressions with User-Code), and maybe I’ll do that later on.  The temptation would be to run analyses against the raw data and use the UDF to basically create an in-memory transformed zone when I am running analyses.  I think I’d still want the transformed later and save on the CPU cycles and memory usage.

The File Preview also has a “Create EXTRACT Script” button, which opens the EXTRACT Script Builder.  Here I can change column names and adjust types.   Note that the preview and column type inference is only the first 100 characters, and some excitement probably lurks (which is why I’m profiling in the first place).

image

Column 7 is the byte size of the requested URL, which I know to be a possible problem spot.  The script builder interprets this as an integer, but scrolling down a few lines my suspicions are confirmed.  Two entries have a byte size of “-“, which won’t parse correctly.  At this exact moment I can’t decide if I want to convert “-” to zero or null (zero will be counted in averages, null won’t) so for now, since I’m just building a profiling script, I’m going to type this as a string and deal with it after I analyze my profiling.

image

Now it’s time to profile my selected file.  This extract script is being generated to run against the one file I selected to preview, so later on I’ll still need to work in wildcards or recursive queries.  As a getting started, one file is perfect.

Before I Submit this script I need to add an OUTPUT statement also, since that’s part of the definition of a complete script in U-SQL.  This has the net effect of rewriting the raw file into the transformed folder with a comma between the columns, but that’s good for a first run.  Here’s the full script of my initial test:


@input =
EXTRACT ip string,
identd string,
remote_user string,
timestamp string,
offset string,
method_file_protocol string,
response int,
size string,
domain string,
url string,
user_agent string,
forwarded string
FROM "adl://redactedprojctname.azuredatalakestore.net/mylogs_raw/2017/access.log.45"
USING Extractors.Text(delimiter:' ');
OUTPUT @input
TO "adl://redactedprojectname.azuredatalakestore.net/mylogs_transformed/input45.txt"
USING Outputters.Csv();

view raw

gistfile1.txt

hosted with ❤ by GitHub

I Submit the script, and success!  But that’s only one file.  How to process all of my logs?

Results: Wildcard and subfolders

This could not have been easier in U-SQL.  All I had to do was change the FROM to read as below, and every log file in both folders was processed into one @input.  I did not have to make lists of subfolders, then loop through the subfolders and read files one at  time like we have to do in C#.  U-SQL handled everything for me.

FROM "adl://redactedprojectname.azuredatalakestore.net/mylogs_raw/{*}/access.{*}"

I can start querying the whole dataset now!  Your mileage may vary based on how much data you have, but this works for me for now.

For a little more information about using files and filesets, see Files and File Sets as Inputs and Outputs (U-SQL).

Log Analysis in Azure Data Lake, Chapter 1

I’m fascinated by data lakes, and the analytics they can power.  If not done well, you can end up with a data swamp (see http://rjdudley.com/prevent-swampification-in-your-data-lake/).  I love what Microsoft is doing with the Azure Data Lake, and the storage, analytics and U-SQL components.  I’ve been looking for an excuse to work with it, and I’ve been interested in better ways to analyze website logs.  I’m writing these blog posts as I build out the data lake, so they may wander or things may change as I progress.  We’ll see how this works out.

First things first–setting up your storage.  With a data lake, you have the option of just throwing everything into one heap, but that’s not a great idea.  This would leave us trying to do analysis directly against raw data, and having to account for any data quality issue or conversions in our analysis queries.  Over time, the format of our raw data may change, adding a layer of complexity to these queries.  Natural lakes have different zones (see http://www.lakeaccess.org/ecology/lakeecologyprim9.html) based on temperature/light/nutrient characteristics, so if we’re extending the lake metaphor, data lakes should also have a number of zones.

While traditional data warehouses are designed for ETL (extract, transform, load), data lakes are designed for LET (load, extract, transform).  I’ll follow the LET pattern and have a raw “zone” (actually a folder) where we land the log files, use U-SQL for the extraction and transformation, then store the results in a transformed “zone” (again, just a folder).  At least that’s the initial idea.  Since this project is small scale I can use simple folders, larger data may need a different strategy.

Another complication is that my host names the files by week-of-year, but no year, so within 52 weeks I would start overwriting files.  I have a couple options here–I could prepend a year onto the filename when I load it, or I could load the files into folders named by year.  Since this is small and I’m manually uploading files, I’m going with subfolders in the raw zone, named for the year.  This may change later as I automate the load process.  Fortunately I can rearrange the raw zone with some PowerShell scripts or the Azure Storage Explorer.  Again, YMMV, so I highly recommend burning every penny of Azure credits you have until you figure out the best strategy for your needs.

Now that I have my two zones, plus raw subfolders, and the log files for the last few months uploaded it’s time to start the E and T.

Prevent Swampification in Your Data Lake

Data lakes have emerged as a promising technology, and continued advances in cloud services and query technology are making data lakes easier to implement and easier to utilize.  But just like their ecological counterparts, data lakes don’t stay pristine all on their own.  Just like a natural lake, a data lake can be subject to processes which can gradually turn it into a swamp.

Causes of Lake Swampification

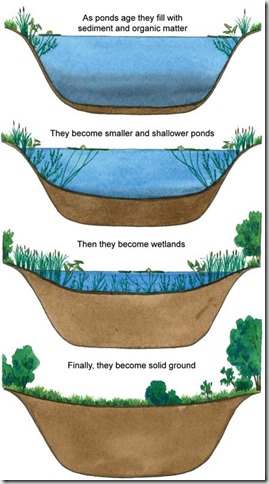
In the biological world, all lakes become swamps over time without intervention.  This process is referred to as “pond succession”, “ecological succession”, or “swampification” (my favorite).  This process is largely caused by three factors: sedimentation (erosion of hard particulates into the lake), pollution (chemicals which shouldn’t be there), and detritus (“decaying plant and animal material”).  Visually, the process resembles the super slo-mo diagram below.

C9_fig_9.4-aquatic-science-texas

(image and quote from http://texasaquaticscience.org/lakes-ponds-aquatic-science-texas/)

Swamps are ecologically diverse systems, but they can also be polluted and rancid breeding grounds for disease.  Because of this, they can be generally undesirable places, and a lot of effort has been expended to keep pristine aquatic systems from becoming swamps.

To extend the lake metaphor into the big data world, data lakes start as pristine bodies, but will require intervention–clean inputs into the system, handling of sediment and rotting material–to prevent becoming a disgusting data swamp.  IBM agrees, stating

A data lake contains data from various sources. However, without proper management and governance a data lake can quickly become a data swamp. A data swamp is unsafe to use because no one is sure where data came from, how reliable it is, and how it should be protected.

With data lakes, it’s important to move past the concept that data which is not tabular is somehow unstructured.  On the contrary, RAW and JPG files from digital cameras are rich in data beyond the image, there just didn’t exist a good way to query these data.  PDFs, Office documents and XML events sent between applications are other examples of valuable non-tabular but regularly arranged data we may want to analyze.

Causes of Data Lake Swampification

Data lake swampification can be caused by the same forces as a biological lake–influxes of sediment, pollution and detritus:

1. In nature, sediment is material which does not break down easily and slowly fills up the lake by piling up in the lakebed.  Natural sediment is usually inorganic material such as silt and sand, but can also be include difficult-to-decompose material such as wood.  Electronic sediment can be tremendously large blobs with little or no analytical value (does your data lake need the raw TIFF or the OCR output with the TIFF stored in a document management system), or even good data indexed in the wrong location where it won’t be used in analysis.  Not having a maintainable storage strategy covering both the types and locations of data will cause your data lake to fill with heaps and heaps of electronic sediment.

2. Pollution is the input of substances which have an adverse effect on a lake ecosystem.  In nature these inputs could be fertilizer, which in small amounts can boost the productivity of a lake while large amounts cause dangerous algal overgrowth, or toxic substances which destroy life outright.  Because data lakes are designed to be scaled wide, it’s a temptation to fill them with data you don’t want to get rid of, but don’t know what to do with otherwise.  Data pollution can also come from well controlled inputs but with misunderstood features or differing quality rules.  Enterprise data are probably sourced from disparate systems, and these systems may have different names for the same feature, or the same name for different features, making analysis difficult.

3. Detritus in a natural lake is rotting organic matter.  In a data lake, maybe it’s data you’re not analyzing anymore, or a partially implemented idea from someone who has moved on, or a poorly documented feature whose original purpose has been forgotten.  Whatever the cause, over time, things which were once deemed useful may start to rot.  Schema evolution is a fact of business–data elements in XML system event messages can be renamed, added or removed, and if your analytics use these elements, your analysis will be difficult or inaccurate.  There may also be compliance or risk management reasons controlling the data you should store, and data falling outside those policies would also be sediment.  Also, over time, the structure of your “unstructured data” may drift.

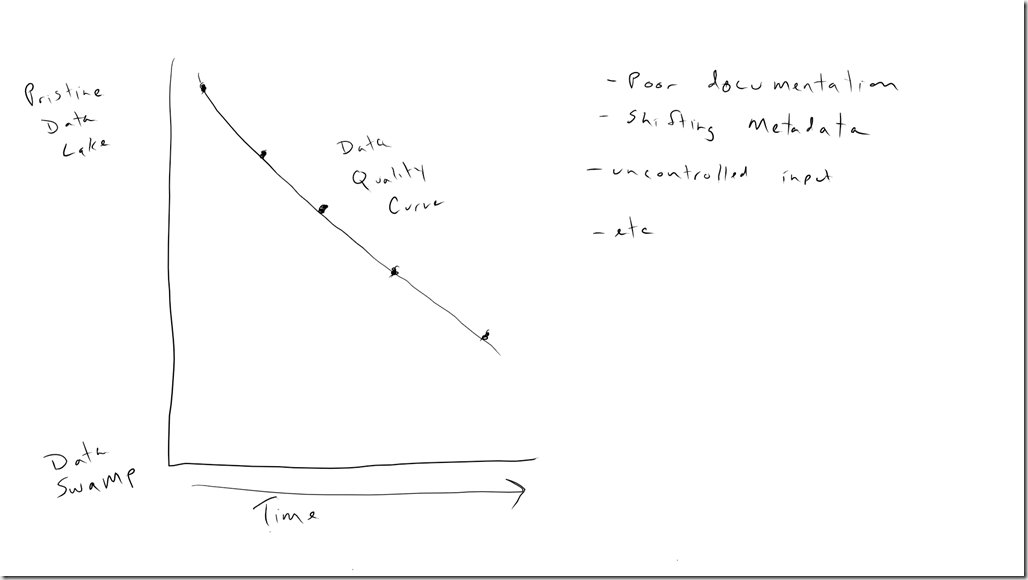
As factors affecting the quality of data in your lake, you can plot a declining “data quality curve” (mathematical models are being developed and may be covered in a future blog post).  Fundamentally, the goal is to keep the data quality curve relatively horizontal.  Below is an example of a mis-managed data lake, undergoing swampification.

Swampification

Preventing and overcoming swampification

1. Have a governance policy regarding the inputs to your data lake.  A data lake isn’t a dumping ground for everything and anything, it’s a carefully built and maintained datastore.  Before you get too far into a data lake, develop policies of how to handle additions to your data lake, how to gather metadata and document changes in data structures, and who can access the data lake.

2. Part of a governance policy is a documentation policy, which means you need an easy to use collaboration tool.  Empower and expect your team to use this tool.  Document clearly the structure and meaning of the data types in your data lake, and any changes when there are any.  The technology can be anything from a simple wiki, to Atlassian’s Confluence or Microsoft’s SharePoint, to a governance tool like Collibra.  It’s important the system you choose is low friction to the users and fits your budget.  Past recommendations for data lake were to put everything in Hadoop and let the data models evolve over time.

3. Another part of a data governance policy is a data dictionary.  Clearly define the meaning of the data stored and any transformations in your data lake.  The maintenance and use should be as frictionless as possible to ensure longevity.  Have a plan for the establishment and the ongoing maintenance of the data dictionary, including change protocols and a responsible person.  If there is an enterprise data dictionary, that should be leveraged instead of starting a different one.

4. Explore technologies with the ability to explore schemas of what is stored and enforce rules.  At the time of this writing, the Azure Data Lake can use PowerShell to enforce storage rules (e.g., “a PNG is stored outside of the image database”) and to explore metadata of the objects in the data lake.  As the data lake ecosystem grows, continue to evaluate the new options.

5. Regularly audit metadata.   Have a policy where every xth event message is inspected and the metadata logged, and implement .  If the metadata differs from expected, have a data steward investigate.  “A means of creating, enriching, and managing semantic metadata incrementally is essential.”8

For some clarity, PWC says

Data lakes require advanced metadata management methods, including machine-assisted scans, characterizations of the data files, and lineage tracking for each transformation. Should schema on read be the rule and predefined schema the exception? It depends on the sources. The former is ideal for working with rapidly changing data structures, while the latter is best for sub-second query response on highly structured data.8

Products such as Apache Atlas, HCatalog, Zaloni and Waterline can collect metadata and make it available to users or downstream applications.

6. Remember schema evolution and versioning will probably happen and plan for it from the beginning.  Start storing existing event messages in an “Eventv1” indices, or include metadata in the event which provides a version so your queries can handle variations elegantly.  Otherwise you’ll have to use a lot of exception logic in your queries.

7. Control inputs.  Maybe not everything belongs in your lake.  Pollution is bad, and your lake shouldn’t be viewed as a dumping ground for anything and everything.  Should you decide to add something to your data lake, it needs to follow your processes for metadata documentation, storage strategy, etc.

8. Sedimentation in a natural lake is remediated by dredging, and in a data lake that means archiving data you’re not using, and possibly having a dredging strategy.  Although the idea behind a data lake is near indefinite storage of almost everything, there may be compliance or risk reasons for removing raw data.

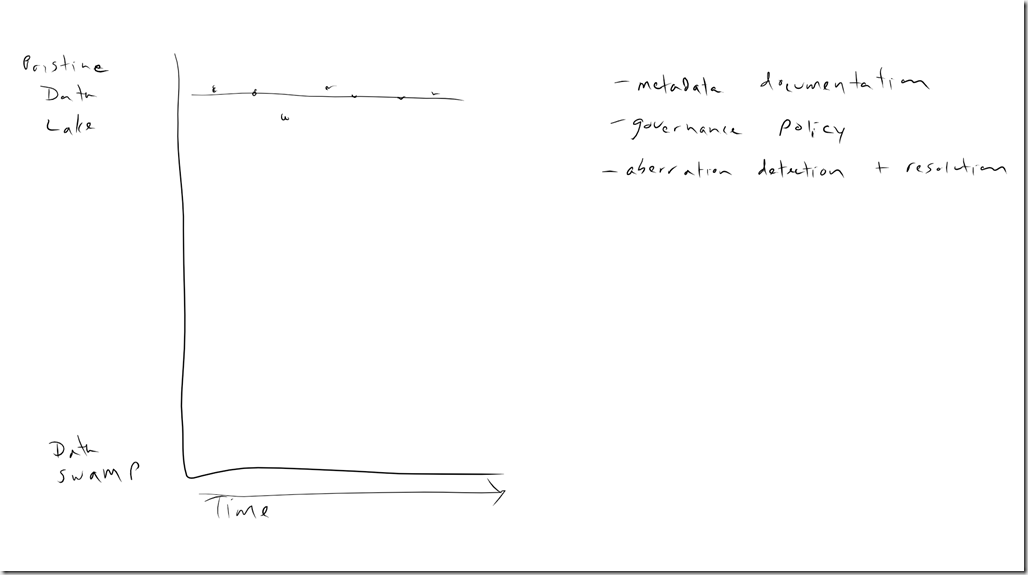
When effort is put into keeping a data lake pristine, we can imagine our data quality curve is much flatter.  There will be times when the cleanliness of our data lake is affected, perhaps through personnel turnover or missed documentation–but the system can be brought back to a more pristine state with a little effort.

not swampifl ation

Additional Considerations

Just as a natural lake is divided into depth zones (limnetic, lentic, benthic, etc.), a data lake the data in a data lake needs a level of organization also.  Raw data should be separated from cleansed/standardized data which should be separated from analytics-ready data.  You need these different zones because, for example, customers usually don’t enter their address information in a standardized format, which could affect your analysis.  Each of these zones should have a specific security profile.  Not everyone needs access to all the data in the data lake.  A lack of proper access permissions is a real risk.

Implement data quality and allow the time for all data to be cleansed and standardized to populate that zone.  This isn’t easy, but it’s essential for accurate analysis and to ensure a pristine data lake.

It may also be beneficial to augment your raw data, perhaps with block codes or socioeconomic groups.  Augmenting the original data changes the format of the original data, which may be acceptable in your design, or you may need to store standardized data in a different place with a link back to the original document.

Additional resources:

1. http://timoelliott.com/blog/2014/12/from-data-lakes-to-data-swamps.html

2. http://www.gartner.com/newsroom/id/2809117

3. http://data-informed.com/4-ways-to-avoid-a-data-swamp/

4. http://www.reltio.com/about/news/2016/4/how-to-keep-your-data-lake-from-becoming-a-data-swamp

5. https://www.ibm.com/developerworks/community/blogs/5things/entry/5_things_to_know_about_avoiding_a_data_swap_with_a_data_reservoir?lang=en

6. Zaloni Bedrock – http://www.zaloni.com/products/bedrock/

7. http://gethue.com/

8. http://www.pwc.com/us/en/technology-forecast/2014/cloud-computing/assets/pdf/pwc-technology-forecast-data-lakes.pdf

9. http://blog.zaloni.com/metadata-is-critical-for-fishing-in-the-big-data-lake

10. http://www.infoworld.com/article/2923875/big-data/3-ways-the-data-lake-is-actually-not-helping-with-it-agility.html

11. http://www.infoworld.com/article/2920116/analytics/5-ways-real-time-will-kill-data-quality.html

12. https://www.oreilly.com/ideas/tips-for-managing-metadata-in-a-data-lake